Posted on April 22, 2017
The location of the first SmartPhones4Water (S4W) project is the Kathmandu Valley in Nepal, which is an area of approximately 587 square kilometers or 227 square miles. It is also home to somewhere between 1.3 and 5 million people. Assuming a 2.5 million person population, and assuming that the population is evenly spread out over the entire watershed (which it isn’t), that’s nearly 4,300 people per square kilometer or 11,000 people per square mile. It’s a lot of people in a little space!
Much of this population growth has occurred over the last 50 years or so, as people have moved to the Kathmandu Valley to escape from political unrest and civil war, or to seek economic opportunities in the big city that weren’t available in more rural areas. This rapid population growth has placed a great deal of stress on the water resources of the Kathmandu Valley. However, how population pressures have impacted water resources have not been fully quantified, and as our favorite Scottish mathematician Lord Kelvin once said, ‘You can’t manage a resource you don’t measure.’ S4W is working to collect the hydrologic data necessary to characterize over time and space the quantity and quality of water in the Kathmandu Valley, all of which will be required to make informed water management decisions in this important water basin.
With such a huge undertaking, where do you begin?
With a map of course! We needed to define the area of interest and better understand the spatial extent and characteristics of the Kathmandu Valley and its water resources. In order to successfully design and implement a successful hydrologic monitoring network, we need to understand where the water is in the Kathmandu Valley.
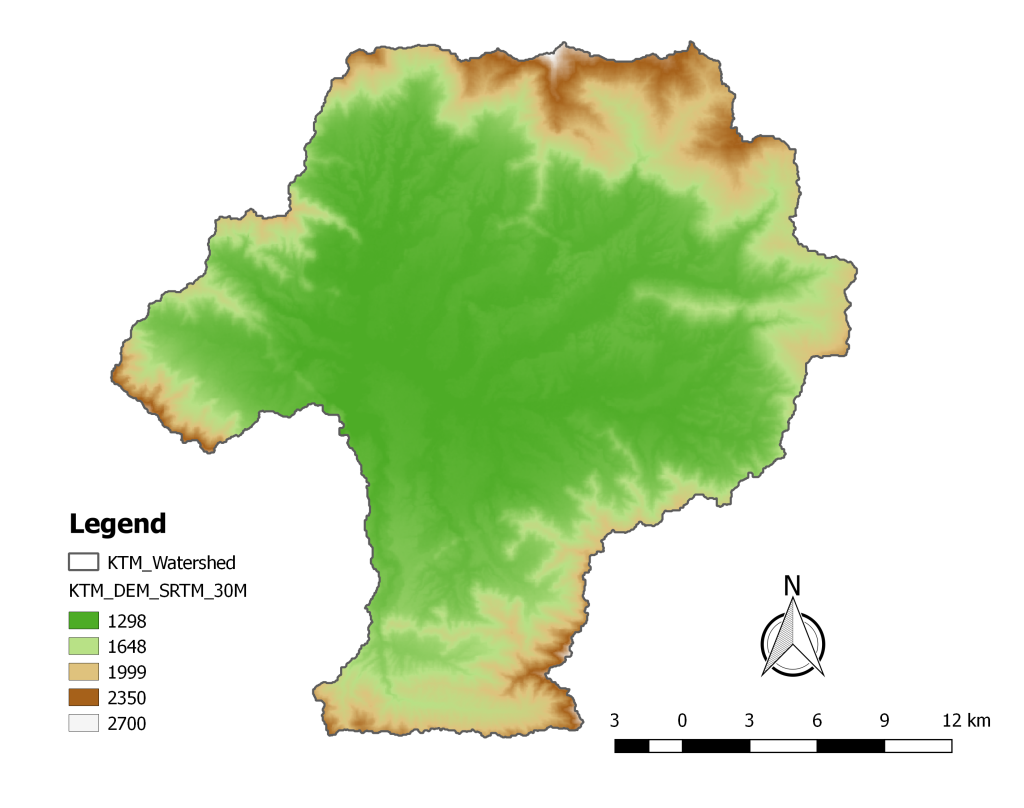
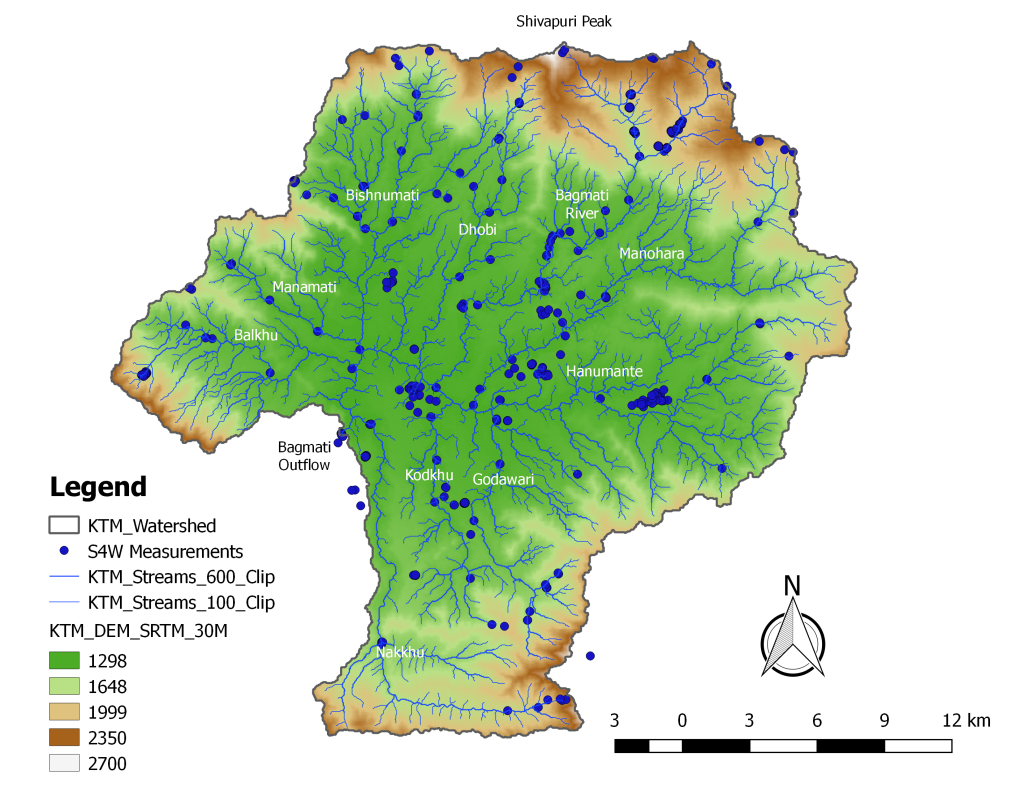
Our initial dataset was produced by NASA as part of the Shuttle Radar Topography Mission (SRTM) mission and is publically available for free. DEM stands for Digital Elevation Model, and it is essentially a very detailed digital topographic map with elevation for every 30 meter by 30 meter area of land (or “pixel”). This is shown in Figure 1. To get a sense of scale, each pixel in a SRTM DEM takes up roughly the same amount of area as the infield of a Major League Baseball diamond field. Within the Kathmandu Watershed (KTM_Watershed) there are over 652,000 pixels, and each pixel has a value corresponding to the average elevation above mean sea level in meters (colors ranging from 1298 to 2700). Using Quantum GIS (QGIS), an open-source GIS software platform, a GRASS module was run on the DEM to develop a coverage of stream networks. The operation analyzes drainage directions from adjacent cells within the DEM, and the user defines the minimum number of cells that need to accumulate (i.e. have upstream cells) before the drainage area is classified as a stream. This was completed, and the results have since been verified through hiking expeditions and exploring the Kathmandu Valley, which is something we’d love to do anyways, so it’s a win-win. The resulting stream network for the Kathmandu Valley can be seen below in Figure 2.
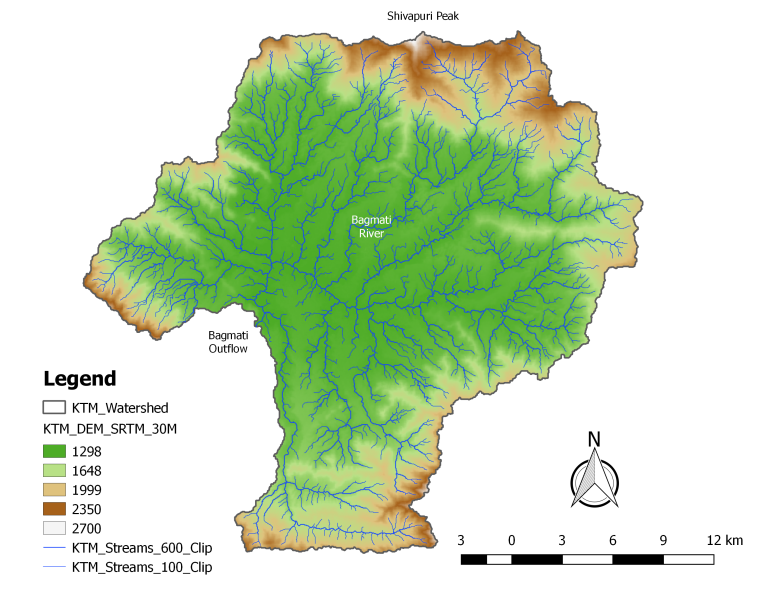
The Kathmandu Valley is in the shape of a giant bowl, with all of the major rivers flowing down to the valley floor, joining together, and then exiting through one outlet. There are nine perennial (flowing year round) tributaries to the Bagmati River within the Valley. Beginning from the furthest south and working our way around the rim of the bowl in a counterclockwise direction, they are the Nakkhu, Kodkhu, Godawari, Hanumante, Manohara, Bagmati, Dhobi, Bishnumati, Manamati, and Balkhu. The Bagmati river starts up in the northern most portion of the Valley on the south slopes of Shivapuri peak, and flows southward all the way through and out of the valley, and the others are tributaries to it.

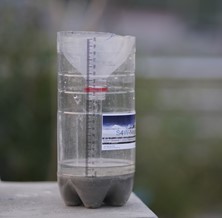
Once the map has been developed and the spatial extent of the study area is understood, the monitoring network can be designed. The objective of a monitoring network is to accurately characterize existing conditions through the data that are collected. Over time, this data record will demonstrate seasonal and annual variations and changes, trends (such as decreasing stream flows or lowering groundwater levels, which are symptoms of an over-exerted water basin) can be seen, and these results can guide leaders to make informed water management decisions. S4W is currently in the process of installing data collection sites and hiring citizen scientists as part of the monitoring network in the Kathmandu Valley. To date, approximately 50 stations have been installed and nearly 1,500 measurements have been taken by a diverse team of 25 citizen scientists, science students, and researchers, and we are continuing to grow. One year from now we aim to have 10 to 20 fixed stream flow monitoring points, 120+ total monitoring locations, 100 citizen scientists, and 4 to 6 full time staff working hard to develop the data necessary to make good water management decisions. Finally, the measurements that have been taken to date can be seen in Figure 4 below.
We could keep going on for a long time on this stuff (we think it’s pretty fascinating), but we’ll wrap this one up here for now. That’s just a little taste of what we’re up to in Nepal; we hope you found it interesting!
As you read this, we are continuing to expand our monitoring network with the installation of new data collection points, our team of citizen scientists with new additions that are also quickly becoming friends, and our dataset with new measurements that will provide the baseline data necessary for wise stewardship of the Kathmandu Valley’s water resources. Thanks for your interest and your support!
Check back next month for our first story on one of our wonderful citizen scientists!